ニュース
3.232015
分かりやすく地図で見る、バンクーバーウェストとイーストの過去5年の価格推移
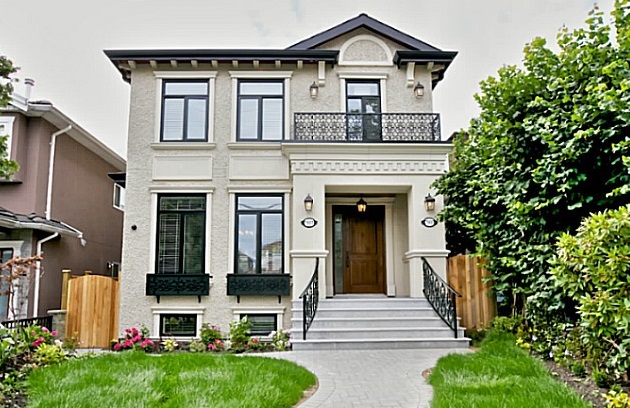
バンクーバー市は大きく西地区(ウェストサイド)と東地区(イーストサイド)に分けられ、以前はメインストリートより東側はアジア人居住区として不動産価格が西地区に比べて格段に安かったのですが、ここ5年程度でイーストサイドもかなりの値上がりとなり、以下の分布図の通り1ミリオン以上の住宅が急激に増えています。これはバンクーバー・アドレスである事に加え、中華系の新移民が好む新築物件の建設が増え、それに比例して地価や住宅価格が上昇していると考えられます。
イーストサイドには長年お住まいの日本人や日系人の方々も多いですので、リタイアメントに合わせてのダウンサイズには絶好のチャンスです。私も土地を探しているビルダーにコンタクトがありますので、古い住宅でも問題ありません。是非お問い合わせ下さい。
バンクーバー不動産、2010年~2015年の不動産価格推移分布図
This fascinating heat map (animated below) has been causing quite a stir in local media this week, revealing that the traditional line between high house prices of Vancouver’s West Side and the lower prices of East Vancouver has blurred considerably in just five years. The map, by urban planning researcher Andy Yan of Bing Thom Architects, takes City of Vancouver data on house prices from 2010 and 2015, and colour-codes homes accordingly. Red denotes house prices under $1 million, moving through orange, yellow, green and blue as the properties get more expensive, up to indigo for houses over $5 million. East Vancouver’s under-$1m homes decrease dramatically between 2010 and 2015, and homes below $1m all but disappear from the West Side over the same period. The longstanding dividing line of Ontario Street, where East and West sides meet, can still be seen in 2015 but to a much lesser degree than five years ago. – See more at: http://www.rew.ca/news/vancouver-s-east-west-house-price-dividing-line-disappearing-1.1796512#sthash.fJ635BEG.dpuf
最近のニュース
-
2025/10/25
-
2025/5/28
-
2025/5/22
-
2025/5/22
-
2025/5/22
-
2023/1/6


